Regional sales performance analysis
Where a year of sales came from: by month, region, sales rep and product category.
The challenge
The business had no clear view of what drives sales across products, people, regions, customers and channels, which made it hard to decide where to put sales effort.
My approach
I cleaned the data in Excel and Power Query, then ran exploratory analysis around eight business questions covering seasonality, rep performance, regions, categories, customer types and channel.
Process
- Kept a raw backup, then removed duplicates and checked for missing values in Power Query.
- Standardised inconsistent entries and checked formats.
- Compared revenue by month, sales rep, region and category in Excel.
What I found
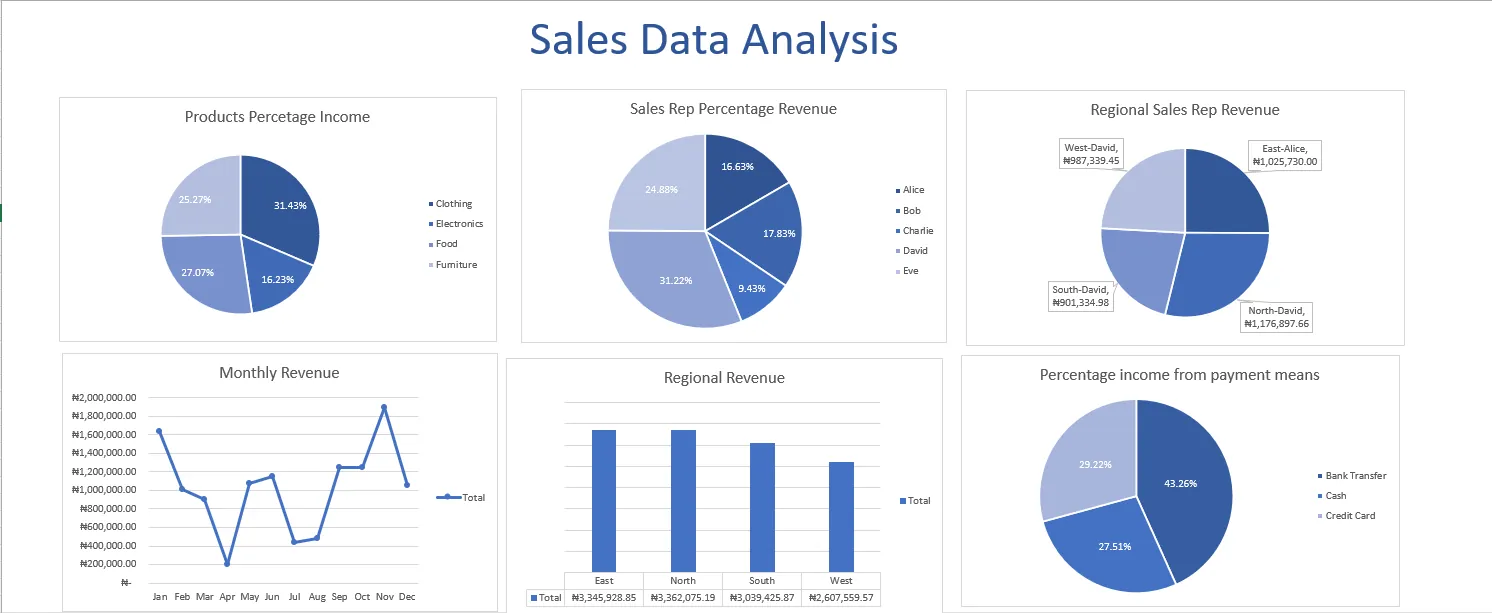
- Total revenue came to ₦12.35 million.
- November was the peak month at ₦1.89 million; April was the lowest at ₦0.21 million.
- The top sales rep brought in ₦3.86 million against ₦1.17 million for the lowest, and led three of the four regions.
- North (₦3.36 million) and East (₦3.35 million) were almost level; West trailed at ₦2.61 million.
- Clothing was the strongest category at ₦3.88 million; Electronics the weakest at ₦2.01 million.
Recommendations
- Document the top rep's approach and train the team on it.
- Investigate the West region gap before moving resources there.
- Check Electronics margins before deciding whether to invest or scale back.
- Assign territories based on proven regional performance.
About the data
The dataset is simulated (500+ transactions across 2023), so the figures show the method rather than a real store.