Fraud detection analysis
A Power BI dashboard for spotting fraud patterns in customer payment transactions.
The challenge
Fraud costs money, reputation and customer trust, and rule-based checks often miss it. The questions: which customers, categories, amounts, months and merchants carry the most fraud risk?
My approach
I worked from a simulated four-month (May to August) set of payment transactions with customer age band, gender, postcode, merchant, purchase category, amount and a fraud label, and framed the analysis around five lenses: demographics, amount, monthly trend, merchant and category.
Process
- Checked data quality, missing values, data types and fraud labels, and standardised categories.
- Defined KPIs: total transactions, fraudulent transactions, fraud rate, total amount, fraud loss and average transaction.
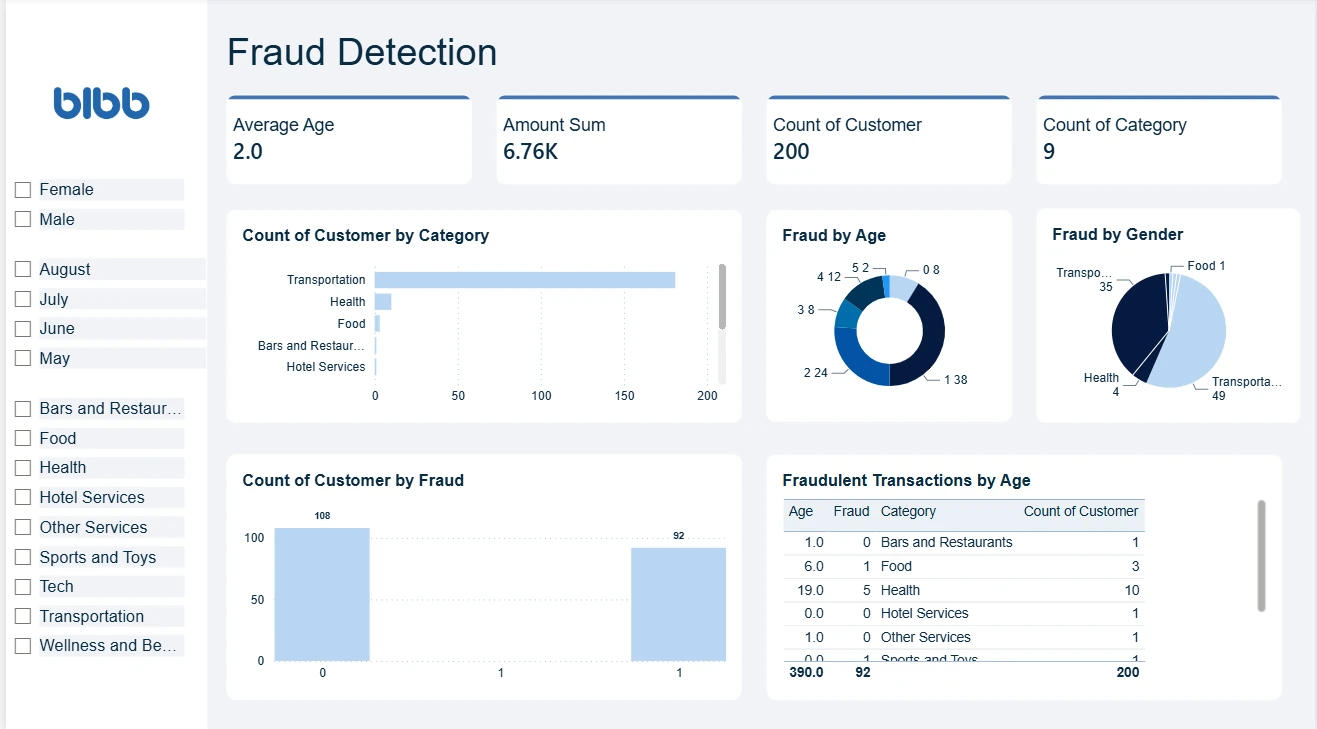
- Built a Power BI dashboard with slicers for gender, month and purchase category.
- Broke fraud down by age band, gender and category, with a drill table of fraudulent transactions by age.
What I found
- The dashboard covers 200 transactions across 9 purchase categories, of which 92 are labelled fraudulent.
- Transportation accounts for most of the transactions, far ahead of Health and Food.
Recommendations
- Automated alerts for high-risk categories and merchants.
- Extra verification for unusually large transactions.
- Customer risk scores built from age, history and behaviour.
- Regular reviews of merchants with elevated fraud rates.
About the data
The dataset is simulated, so the project shows the method rather than describing a real bank.